











In an era defined by hyper-globalization, the journey of the food on our plates has become increasingly opaque. While consumers in developed nations walk into supermarkets stocked with produce from every continent, the mechanisms governing this massive, intricate logistical dance remain largely invisible to the public. A new interactive tool from Our World in Data, titled "How does food get traded around the world?", seeks to demystify these flows, offering a granular look at the movement of calories, commodities, and processed goods across borders.
Main Facts: The Anatomy of Global Food Chains
The Our World in Data project serves as a comprehensive dashboard for agricultural economists, policymakers, and curious citizens alike. At its core, the tool visualizes the "who, what, and where" of international food commerce. Users are presented with a series of interactive visualizations that track specific commodities—from staples like maize and wheat to processed goods like yogurt—as they traverse the globe.
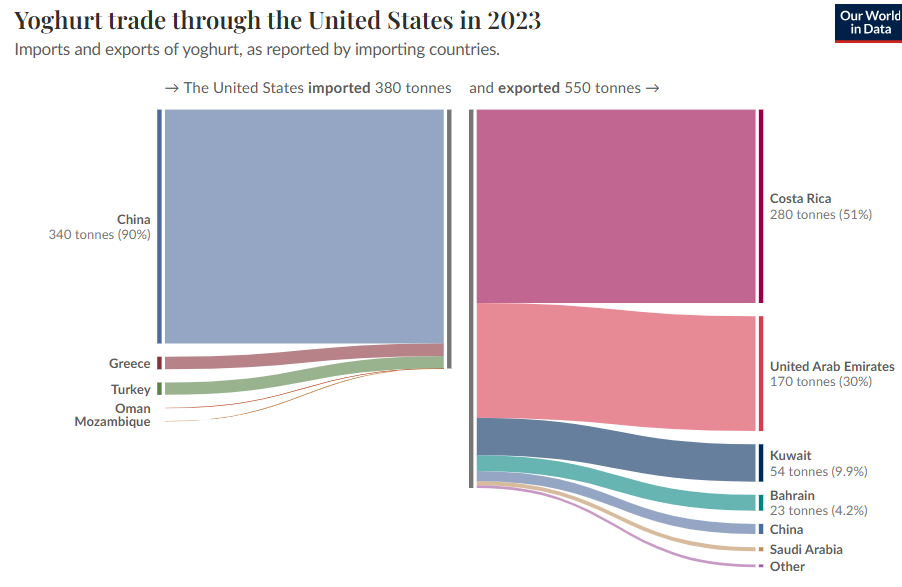
The platform distinguishes between the sheer scale of raw material trade and the more nuanced movement of value-added products. By allowing users to toggle between exporting and importing nations, the site highlights the heavy reliance many countries have on a handful of key agricultural powerhouses. For instance, a cursory look at the United States reveals its role as a massive exporter of feed grains, while a shift to a product like yogurt illustrates a more regionalized trade dynamic, often dictated by shelf-life, refrigeration logistics, and trade agreements.
The site intentionally avoids overwhelming the user with "impossibly complicated" macro-charts—such as the 2023 global maize trade overview, which serves more as a cautionary tale of data density than a tool for quick insight. Instead, the interface invites users to engage in "what-if" scenarios, enabling a bespoke exploration of trade dependencies.
A Chronology of Globalized Nutrition
To understand why such a tool is necessary today, one must look at the evolution of the global food system over the last century.
The Pre-Industrial Era (Pre-1950s)
Historically, food systems were largely local. Nutrition was tied to the immediate geography of a community, and "trade" was limited to non-perishable spices, grains, or dried goods transported over long distances via maritime routes.
The Green Revolution and Infrastructure Boom (1960s–1990s)
The advent of the Green Revolution, characterized by high-yield crop varieties and advanced irrigation, transformed food into a global commodity. As cold-chain logistics—refrigerated shipping containers and advanced air freight—became more affordable, the "global plate" began to take shape. During this period, food became a pillar of national security and diplomatic leverage.

The Digital Integration Era (2000s–Present)
We have now entered an era where data transparency is the new frontier. As supply chains have grown more volatile due to climate change, geopolitical conflicts (such as the war in Ukraine), and post-pandemic recovery, the need for real-time, accessible trade data has shifted from a luxury for academics to a necessity for national policy planning. The Our World in Data project represents the latest milestone in this trend toward "radical transparency."
Supporting Data: Visualizing the Flow
The utility of the Our World in Data tool lies in its ability to reveal patterns that are often obscured by broad economic reports. By isolating specific countries and products, users can observe the "geography of consumption."
The Commodity Paradox
When examining major exporters like the United States, the data reveals a high-volume, low-margin flow of bulk commodities. These are the building blocks of the global diet—maize for feed, soy for oil, and wheat for staples. The charts demonstrate that the U.S. is not merely a provider of food, but a foundational node in the global livestock and biofuel supply chains.
The Processed Goods Shift
Conversely, when users shift the focus to products like yogurt, the data paints a different picture. Unlike grain, which can be stored in bulk silos for months, yogurt represents the "perishable economy." The trade routes for such items are often shorter, dominated by regional trade blocs (such as the EU or NAFTA/USMCA), reflecting the high cost of maintaining the cold chain. This data supports the argument that while we live in a "global" economy, our consumption of fresh, processed dairy remains tethered to regional infrastructure.
Official Responses and Expert Perspectives
Agricultural economists and food policy experts have largely lauded the move toward more intuitive data visualization. "The complexity of the global food system is often used as a shield against public scrutiny," says one food policy researcher. "By breaking down trade into digestible, searchable segments, we empower consumers to ask the right questions about their own food sovereignty."
However, industry groups warn that such tools, while informative, do not tell the full story of quality, labor standards, or environmental impact. A spokesperson for a major agricultural trade association noted, "While visualizing trade flows is helpful, it is important to remember that trade data is a measure of movement, not a measure of value, sustainability, or ethical production. It is a starting point for a conversation, not the conclusion."
Implications: Sovereignty, Security, and Sustainability
The launch of such a tool arrives at a critical juncture in global politics. As nations grapple with the dual threats of climate change and supply chain fragility, the implications of these trade flows are profound.
1. The Vulnerability of Interdependence
The data makes it clear: no nation is an island. A drought in one hemisphere or a tariff war in another can ripple across the globe, affecting the price of yogurt in a supermarket thousands of miles away. Understanding these dependencies is the first step toward building more resilient, diversified food systems.
2. The Environmental Footprint
The "food miles" debate—the distance a product travels from farm to fork—has long been a contentious issue. The ability to visualize these trade routes allows environmental researchers to better calculate the carbon intensity of specific national diets. It forces a reckoning: is it sustainable to rely on international imports for items that could be produced locally?
3. Policy and Pre-orders: The Broader Discourse
The discourse surrounding food politics extends beyond data to the literature that frames it. As seen in the recent academic and non-fiction publishing cycles, such as the upcoming release of Sugar Coated (published by UC Press, September 8), there is a growing appetite for works that scrutinize the intersection of global trade, health, and corporate influence. Readers are increasingly seeking out resources—both digital and print—that pull back the curtain on how food reaches the table. (Note: Pre-orders for such titles often utilize promotional incentives like the code UCPSAVE30 to encourage widespread engagement with these complex topics.)
Conclusion: The Future of the Transparent Plate
The Our World in Data tool is more than a digital novelty; it is a lens through which we can view the hidden mechanics of our modern existence. By ignoring the overly complex noise and focusing on the specific, actionable flows of commodities, we can begin to comprehend the massive, invisible web that sustains 8 billion people.
Whether you are a student, a policy wonk, or simply a consumer curious about why your breakfast yogurt might have traveled across a border, the data is now at your fingertips. The goal, ultimately, is not just to see where food goes, but to understand why it moves, what it costs the planet, and how we might build a more equitable, sustainable system for the future. As we move further into the 21st century, transparency will be the most vital ingredient in the global food supply chain.